
Real progress on the map, table by table.
Load the surveyor’s file and the site appears on satellite imagery: tables, rows and codes. Each report and inspection colours the map, so you see what is done, what waits for QC and what needs rework.
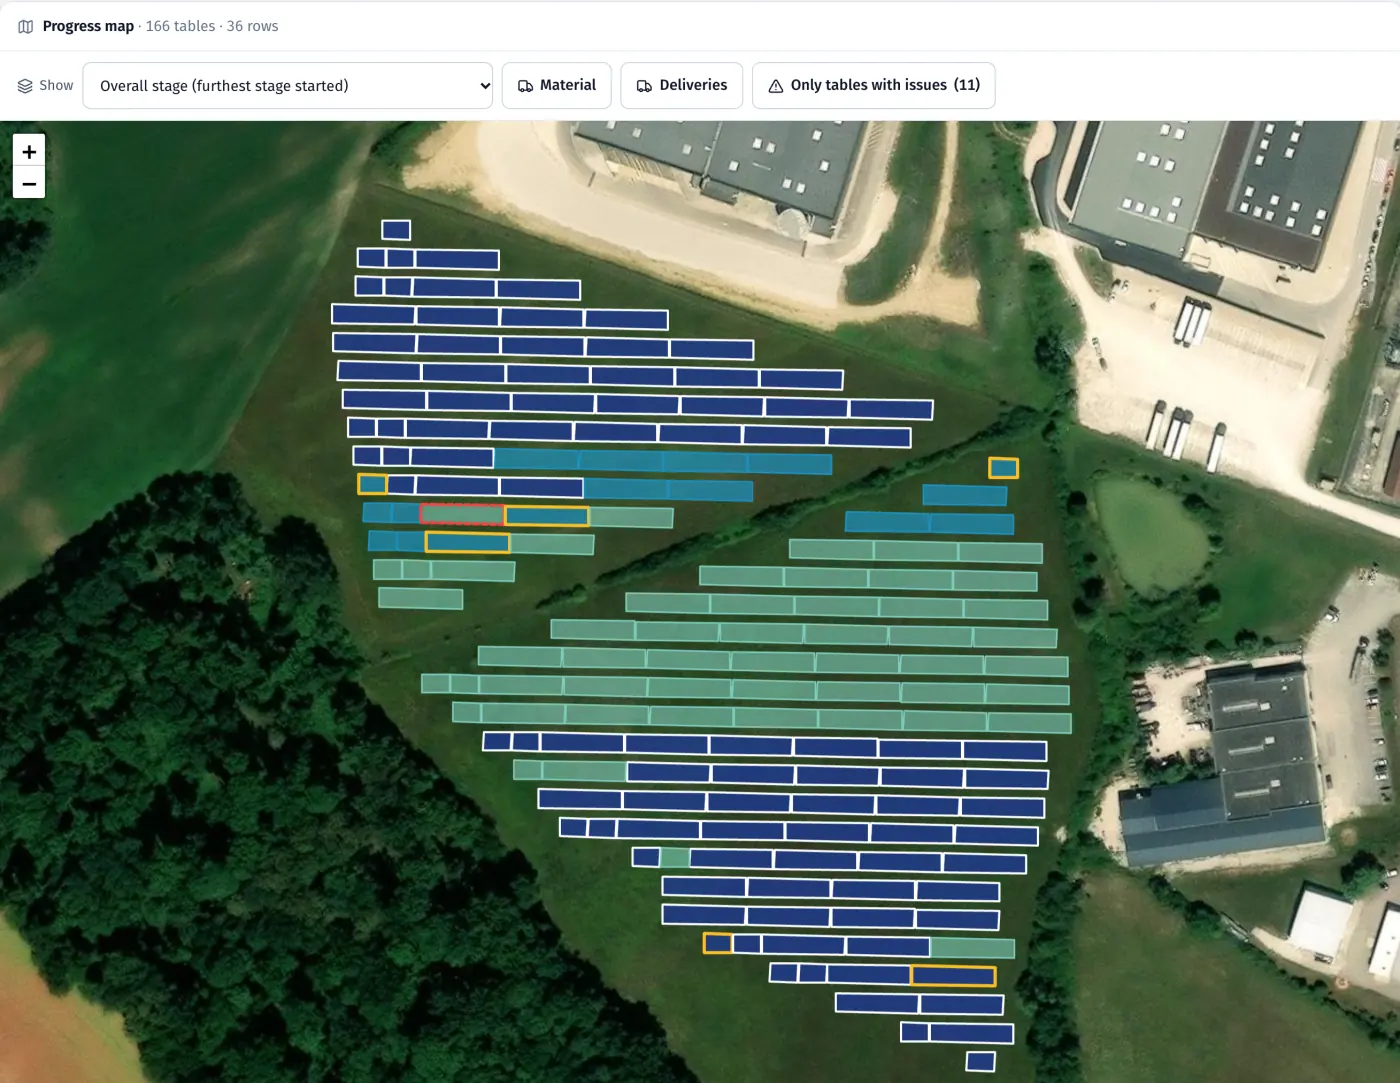
Product screenshots · sample data from a demo project
- 10,000 tables per project (about 90 MWp)
- KML · DXF · CSV · GeoJSON surveyor file formats
- Lambert-93 · PL-2000 · UTM coordinate systems
What it does
- 01
Start from the surveyor’s file
KML, DXF, CSV or GeoJSON, in Lambert-93, PL-2000 or UTM. Tables, rows and codes appear on a satellite map.
- 02
Coloured by stage
The furthest stage started on each table; in progress, waiting for QC and rework shown as outlines. Click a legend item to show only those tables.
- 03
Progress counted after acceptance
For each work type: to do, done and passed QC, with overall progress weighted by contract weights.
- 04
A card for each table
History, photos, decisions and protocols one click from the map. In the app, add a task straight from the table card.
- 05
The same map in the app
Crews see the map on their phone, with a “Today” view and the way to their table.
- 06
EPC rejections in their own colour
Tables rejected by the EPC look different from your own QC NOKs.
- 07
Layers, one stage at a time
Show or hide tables, trenches by cable type, fence, road and devices by type, with counts. Step through the map one stage at a time: not yet, in progress, waiting for acceptance, done, rework.
- 08
Satellite or map
Each map in the panel and the app switches between satellite imagery and a light map with the project’s roads, buildings and water.
In the product
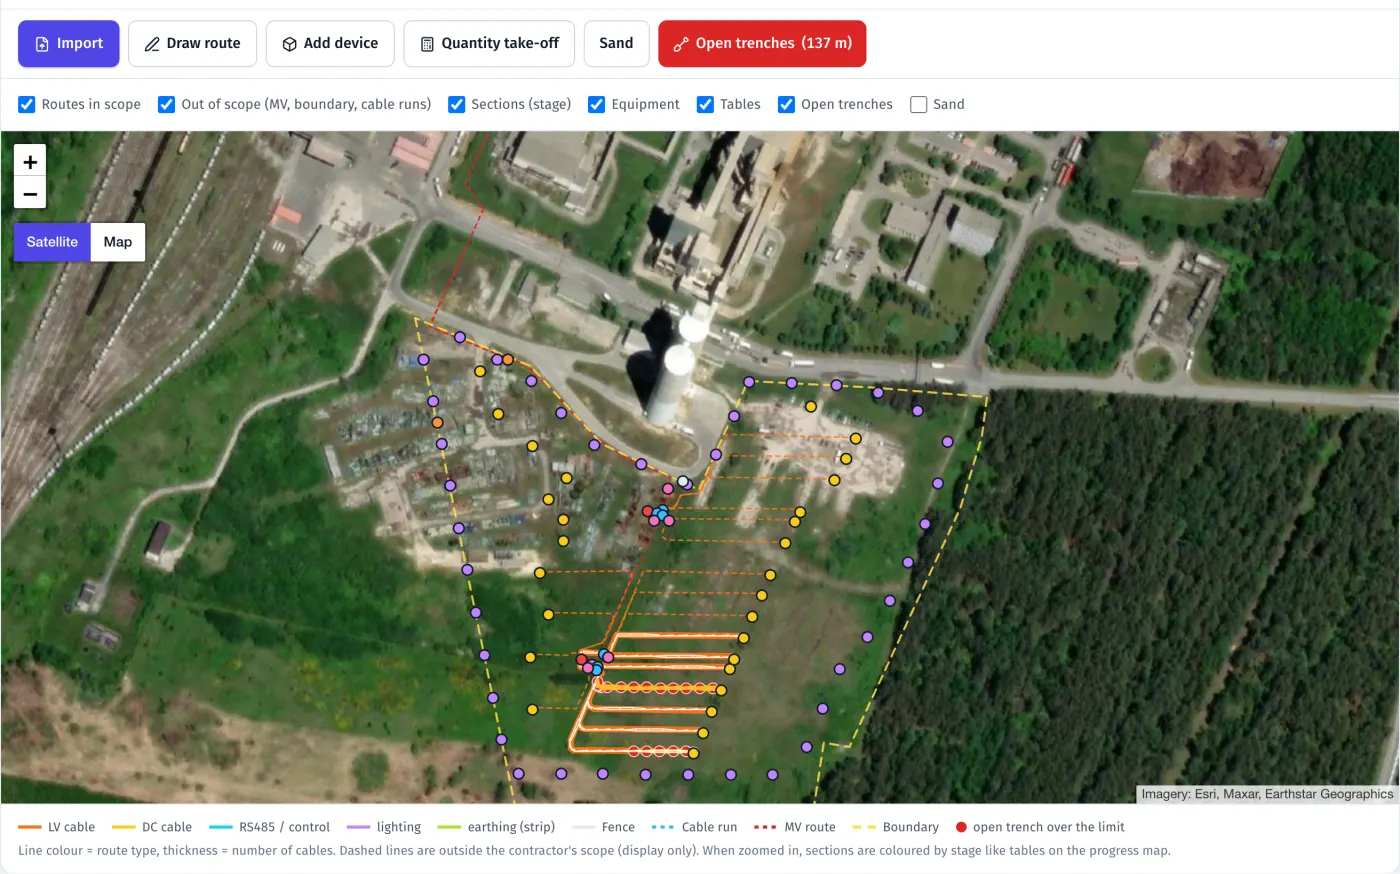
Routes and devices: trenches by cable type, earthing, fence, inverters, lamps and boxes on satellite imagery, with open trenches flagged
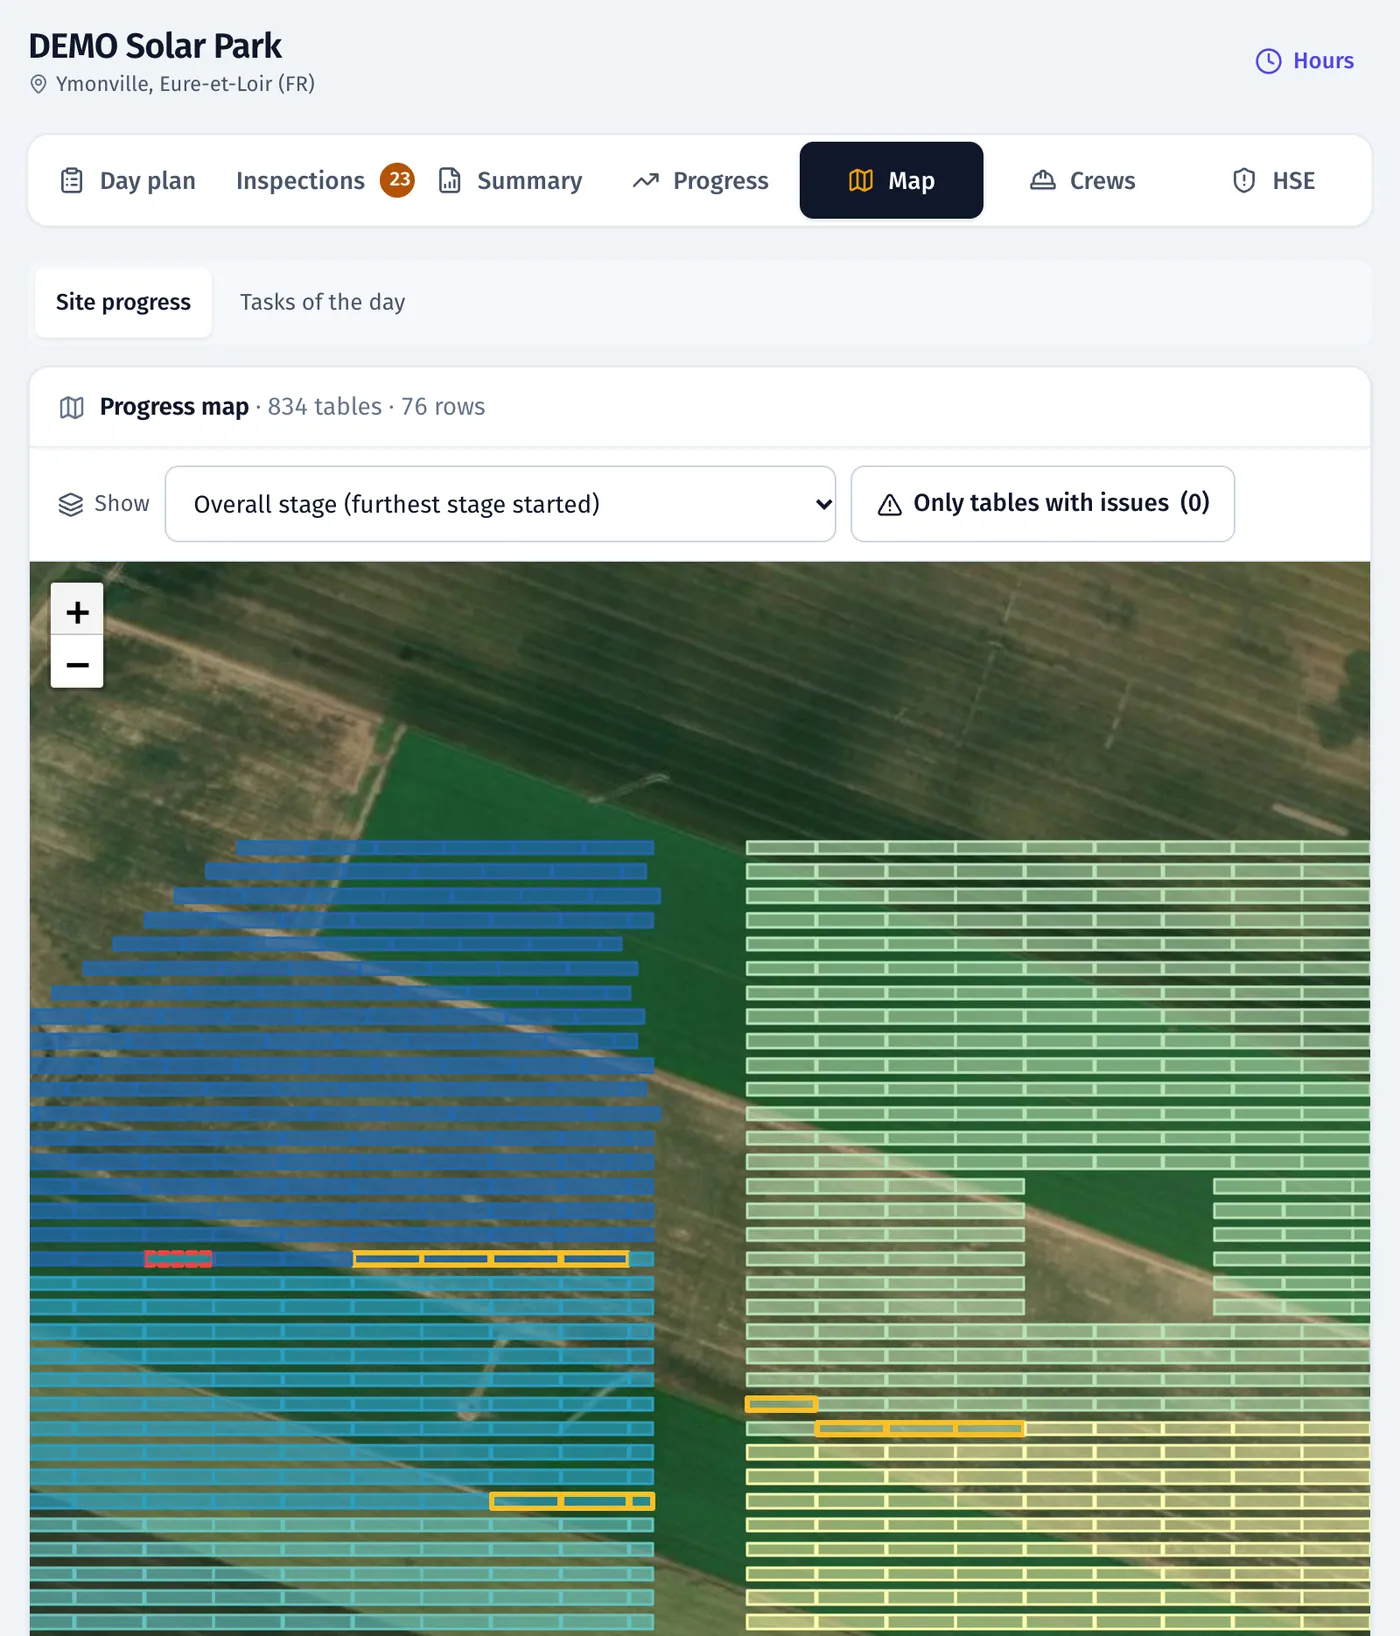
Progress map on satellite imagery, tables coloured by work stage
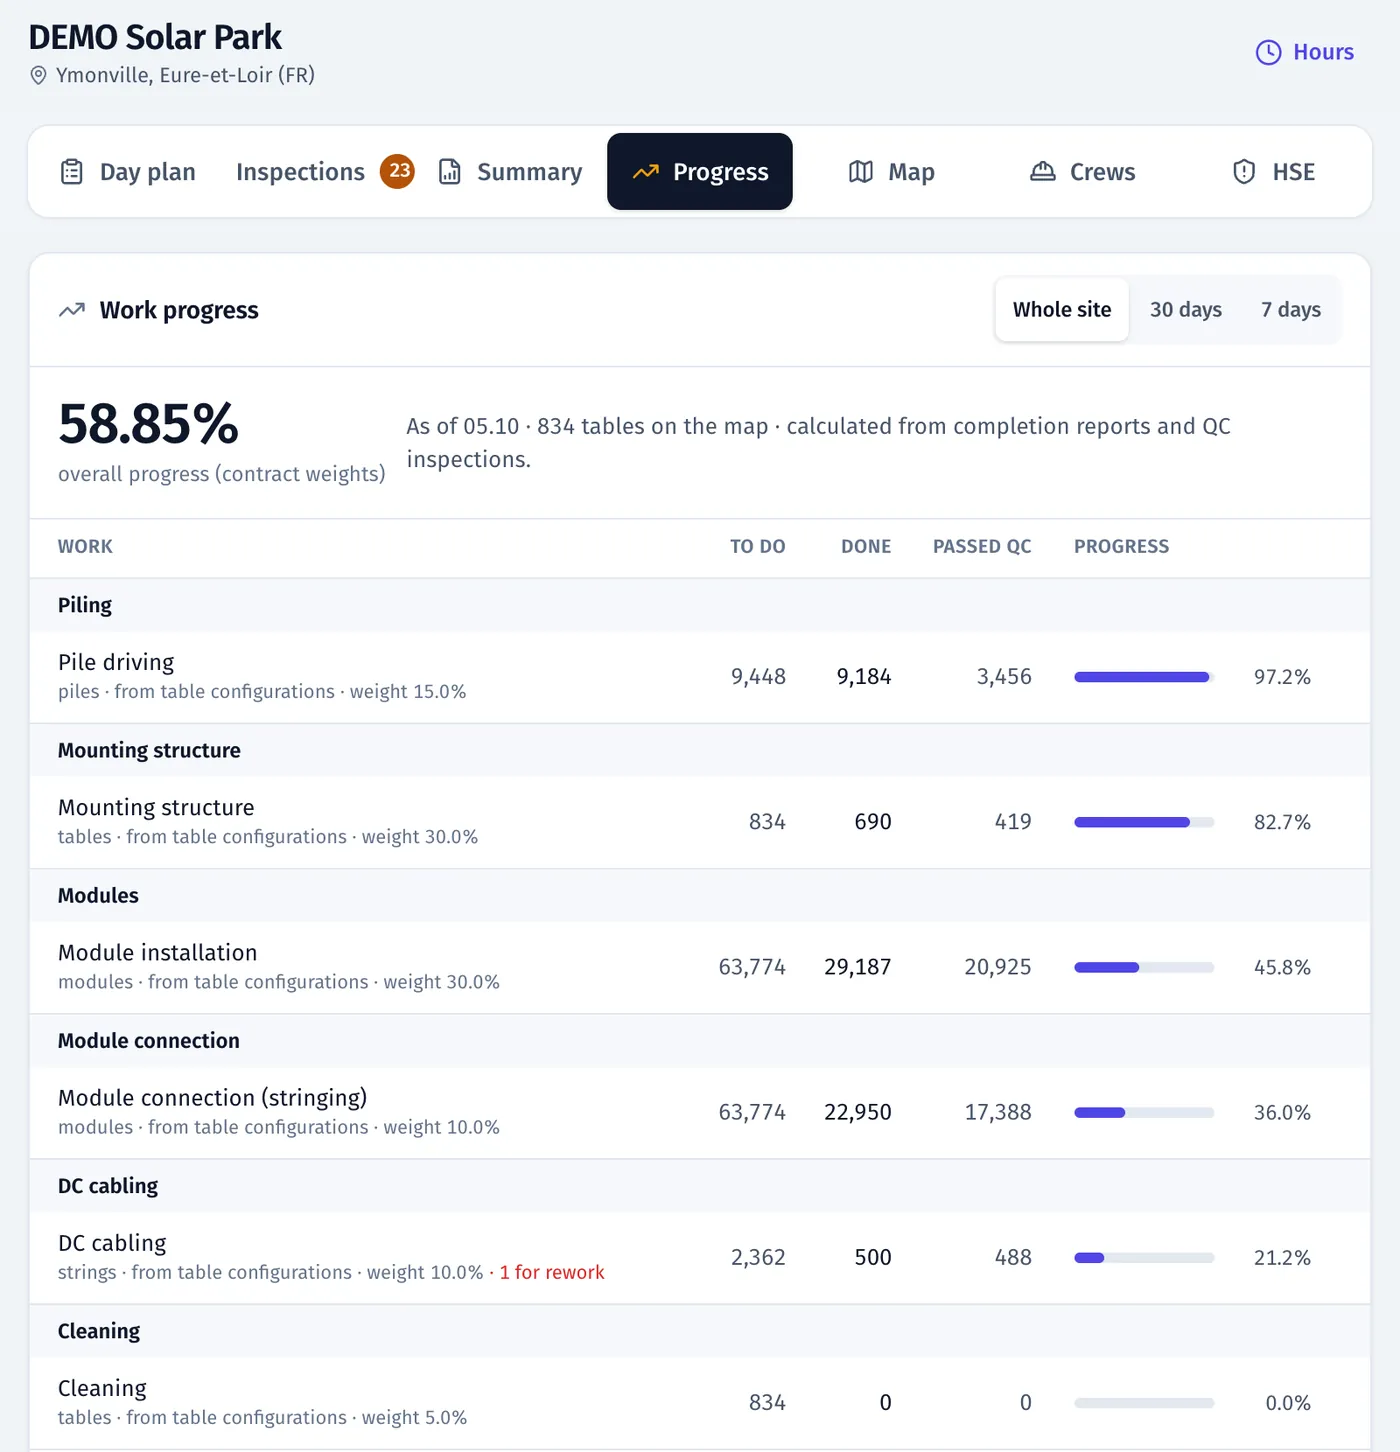
Work progress: done and accepted by QC for each work type
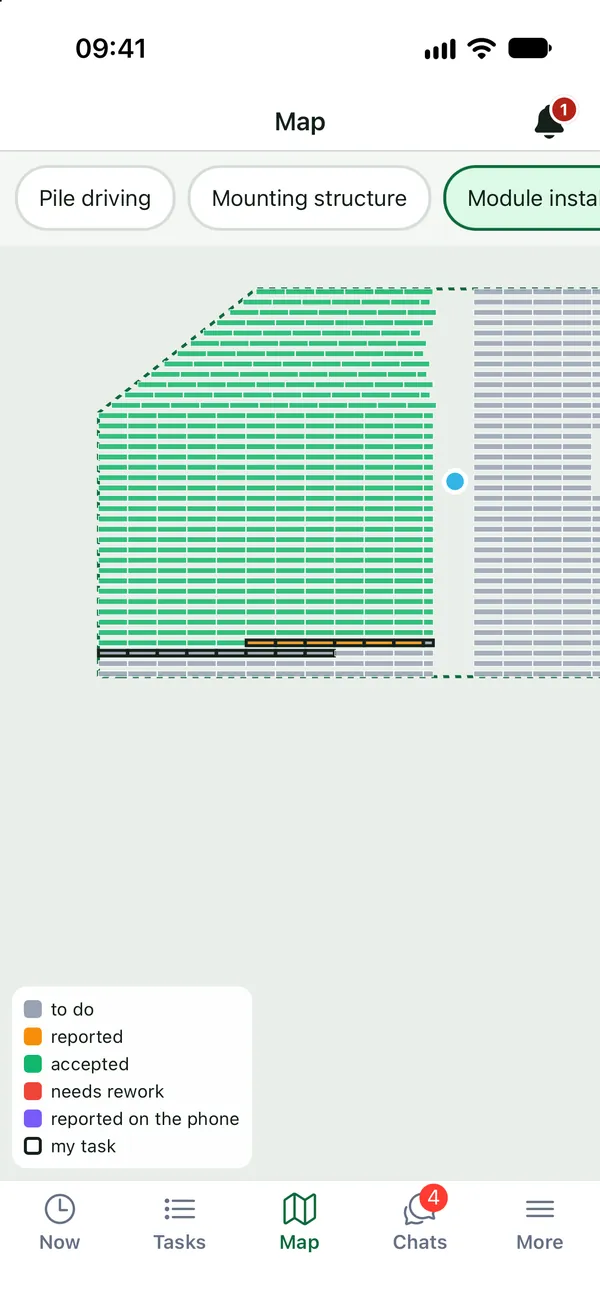
Mobile app: site progress map
Product screenshots · sample data from a demo project
See your own site in FieldSpine.
Send us your table layout file or describe your project. In a 30-minute demo we show you your site in FieldSpine. No commitment.